Overall Performance
At a glance, the Dashboard gives you a clear snapshot of your advertising performance through Key KPIs, a Line Chart, and a Campaign Table — all based on your selected time range.
Key KPIs
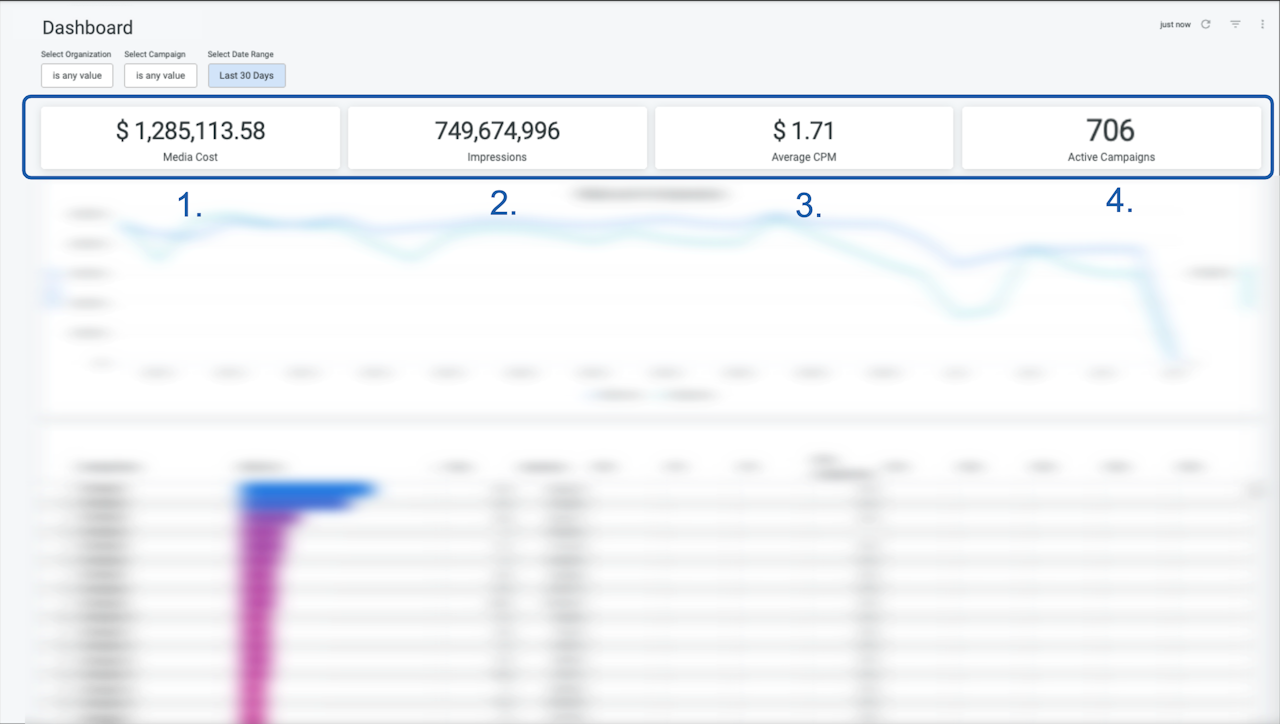
At the top of the Dashboard, you’ll find key performance indicators for your organization:
- Media Cost (in your organization’s currency)
-
Number of Impressions
-
Average CPM (in your currency)
-
Number of Active Campaigns
These KPIs help you quickly assess how your media spend and delivery are evolving.
Line Chart
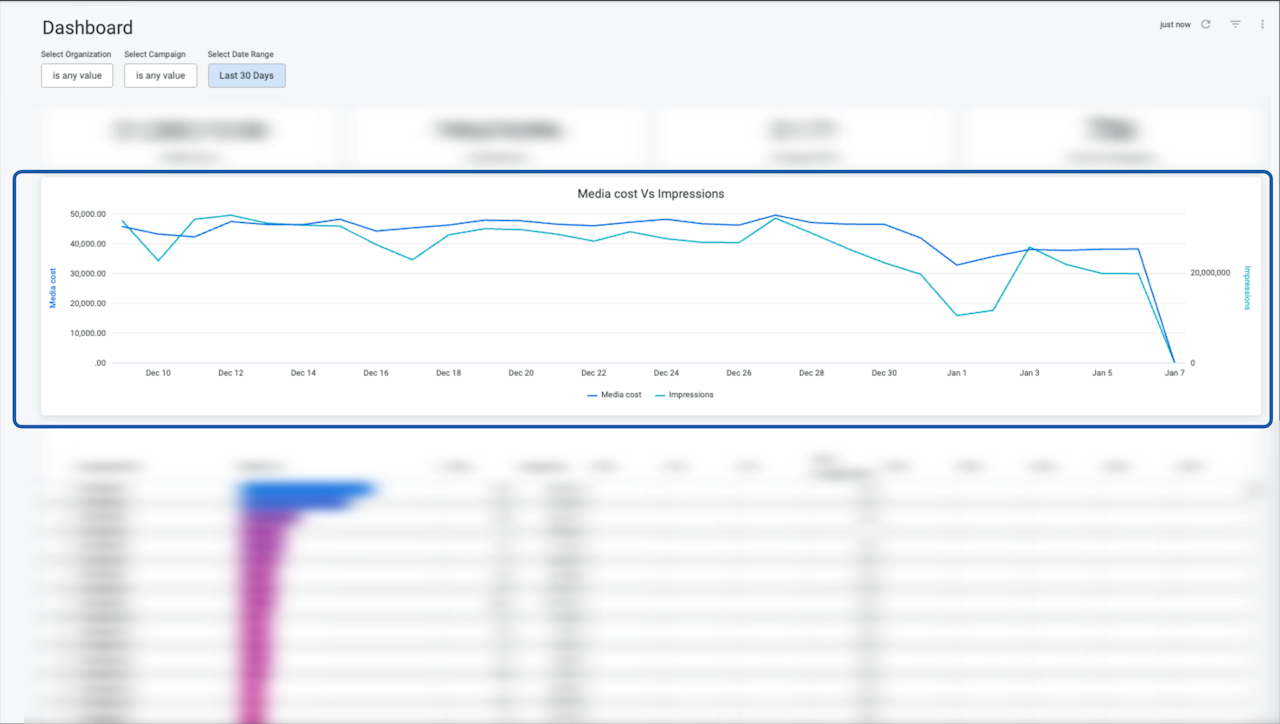
The line chart visualizes the trends for:
-
Media Cost
-
Impressions
You can toggle each metric on or off by clicking its name in the legend below the chart — great for isolating specific trends.
Campaign Table
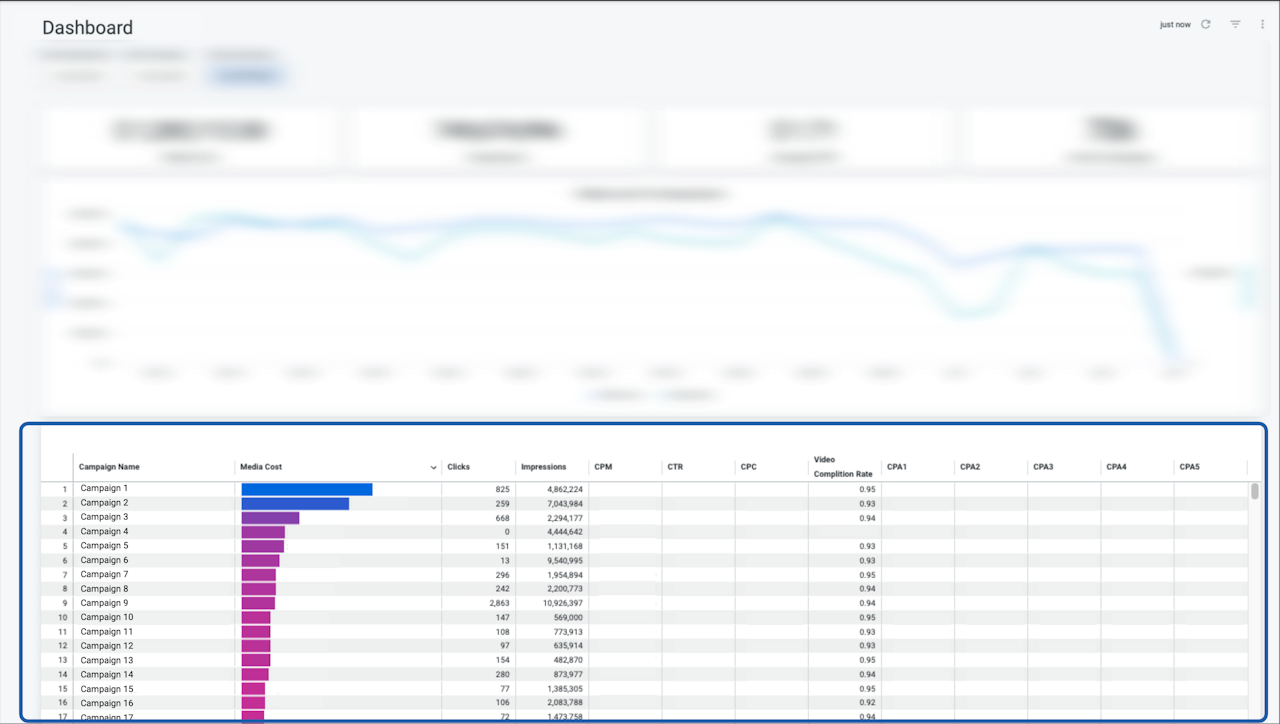
This table provides a detailed view of performance by campaign, including:
-
Campaign Name
-
Media Cost
-
Clicks
-
Impressions
-
CPM
-
CTR
-
CPC
-
Video Completion Rate
-
(Optional) CPA 1 to CPA 5 — if configured for your campaigns
Use this section to quickly compare campaigns and evaluate their effectiveness.


